
Fully bespoke dashboards driven by your needs. Utilise our in-house team of designers, clinicians, healthcare analysts and software developers to bring your value story to life.
Visualise your own datasets or those available to Corevitas including UK HES and prescribing as well as therapy specific datasets such as retina or oncology, covering the US and other markets.
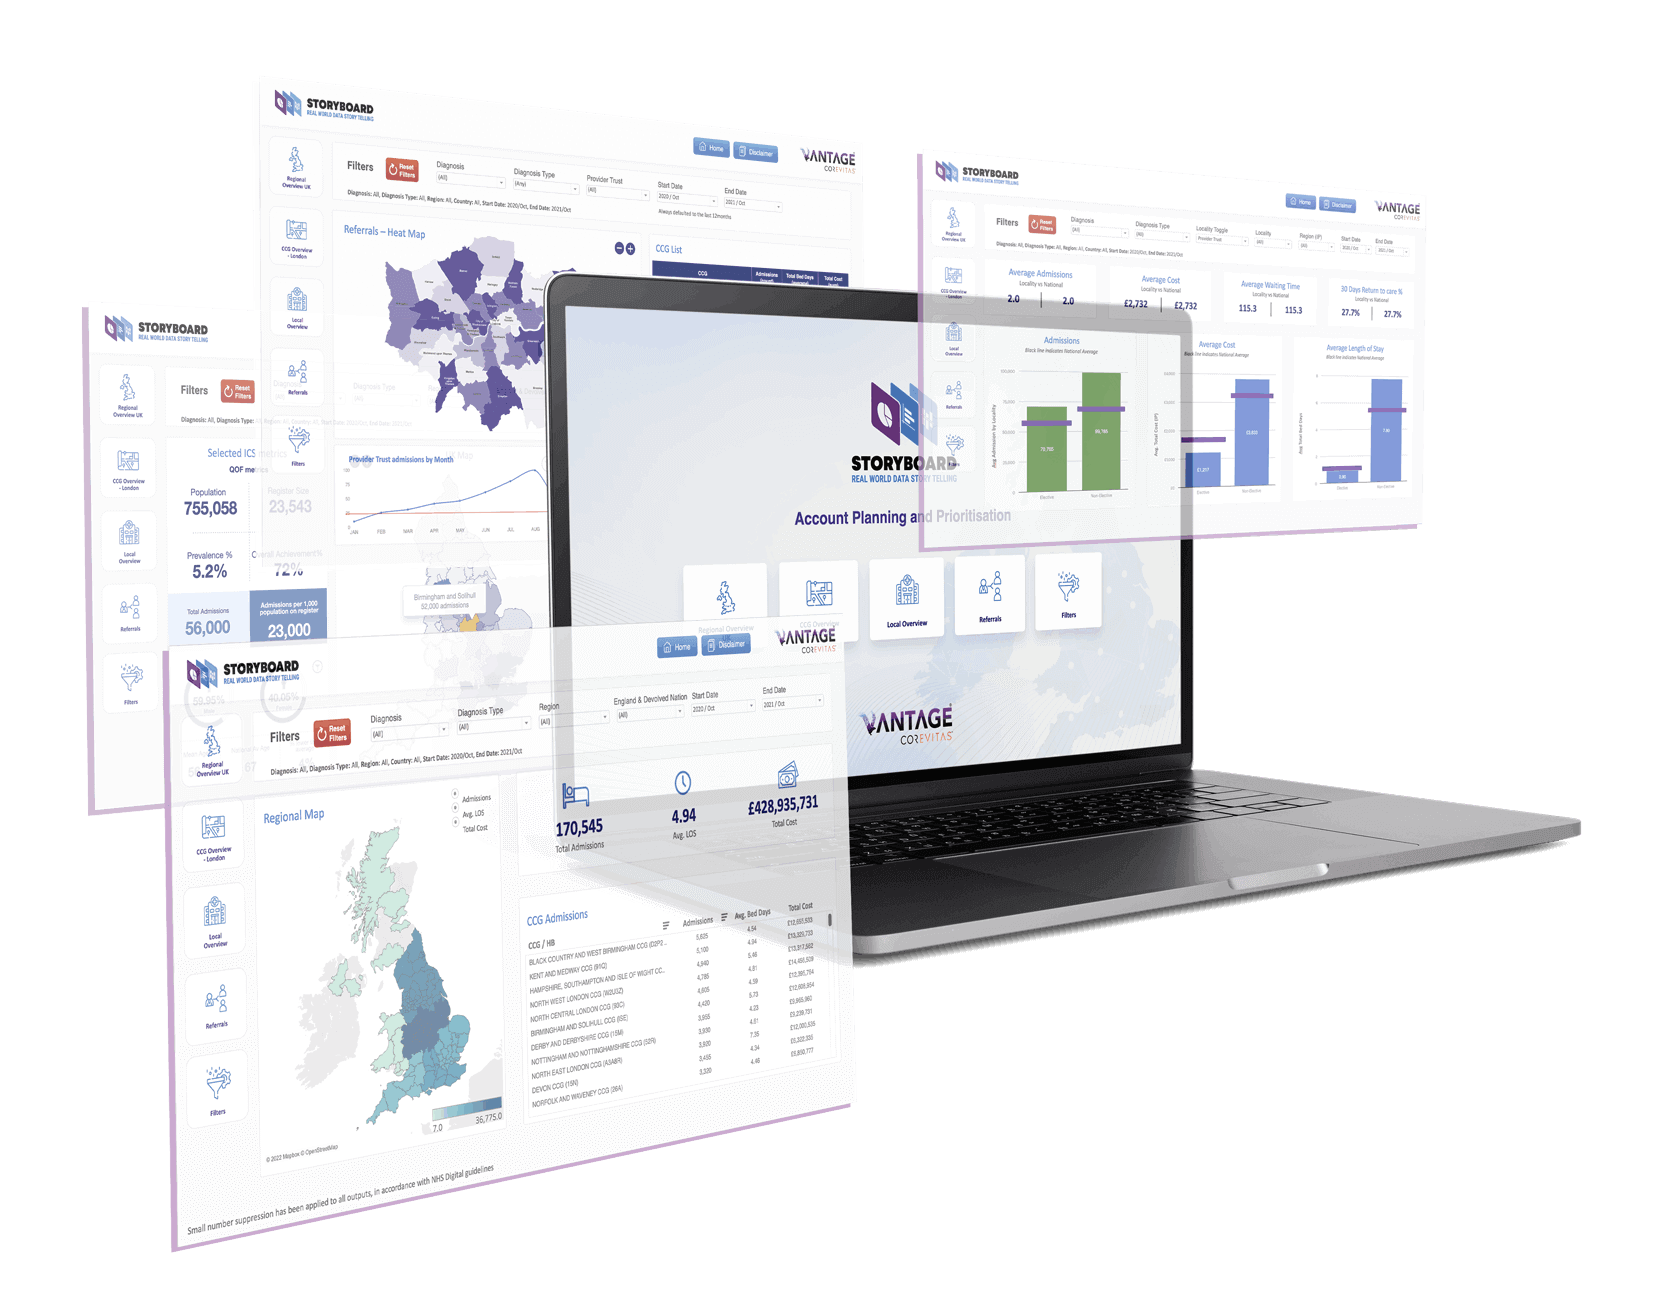
Interactive dashboards with stats, charts, graphs and heatmaps to enable users at all levels to quickly interrogate complex data.
Take content offline into Excel or PowerPoint for further analysis or to share with colleagues and/or externally with healthcare professionals.
DATASETS
CHART TYPES
INTERACTIONS (FILTERS, TOGGLES ETC.)
EXPORT OPTIONS
DESIGNED AND BRANDED
Visual RWD to support your messages to healthcare professionals.
Map local deprivation issues and understand how various areas can experience different health outcomes.
Monitor trends over time and call attention to outliers to support your account management.
Observe prescribing activity by product and/or indication to track market share and competitors.